Generally, when a company does a market analysis, they are interested in the sales potential for a current or future product. For most markets, there is data available from market research companies for that purpose, and companies will generally have procedures in place to base their analyses and their forecasts on that.
That, however, generally does not include looking at the global impact of what creates the market. Automobile manufacturers, for example, have increasingly been seeing themselves as suppliers of mobility for more than two decades, and while the impact is still not visible everywhere, they have started developing technologies accordingly. When looking at market volumes, however, the focus is still usually on the market for a certain type of vehicle, not for a certain mobiliy need – and for the decisions of everyday business, that is absolutely reasonable.
For a pharmaceutical company, a market analysis usually starts with the number of patients affected by a certain medical condition. Shortly after that, however, comes the question of the share of those patients that is or will be treated with pharmaceuticals. That share is then broken up by treatment regimes or substance classes to identify the share of the market that is accessible for a specific product. As always, whether that procedure makes sense depends on what is relevant for the decisions at hand. If the decisions to be made involve investing into certain products in different markets to build a well-rounded portfolio, this is certainly the way to go.
There are, however, situations when quite a different perspective on the market is needed. In the healthcare industries, that is particularly true when dealing with regulators, health insurance systems and politics. Putting pharmaceuticals in relation to the cost of hospitalization can make the price of a novel drug look much less outrageous, and even extended inpatient treatments can have moderate cost in comparison to the societal effects of inability to work. In other businesses, there are also stakeholders with a quite different focus: Putting company sales into the perspective of the overall impact of the problems which the company’s products are helping to solve can provide meaning to employees, affirmation to customers, and visions of future growth to stockholders. For these purposes, the numbers don’t have to be exact, but they have to be reasonable and defensible, and it should be possible to make the way the have been derived transparent in discussions, even if not all details can be revealed.
The challenge in providing this type of information is that it is relatively far from what internal marketing, strategy or research departments and even external market research companies are usually asked to deliver. Information on less globalized market segments (like home-care nurse services in healthcare or bicycle repairs in traffic) and on societal impacts (like missed work days or logistics time lost in congestion) are usually not available as comprehensive market research data. There is usually some fragmentary information available from scientific studies or statistics offices, but that will hardly suffice to give a clear view of the overall numbers, let alone effects like market dynamics and the potential effects of uncertain future developments.
In such a situation, large companies are in a unique position to derive that kind of information: They tend to have a profound understanding how the market works and the best (even non-public) data available for the specific segments of the global market they are active in. Combining that with publically available, but less detailed, data can allow them to provide unique value in communication with regulators, politicians and internal stakeholders alike.
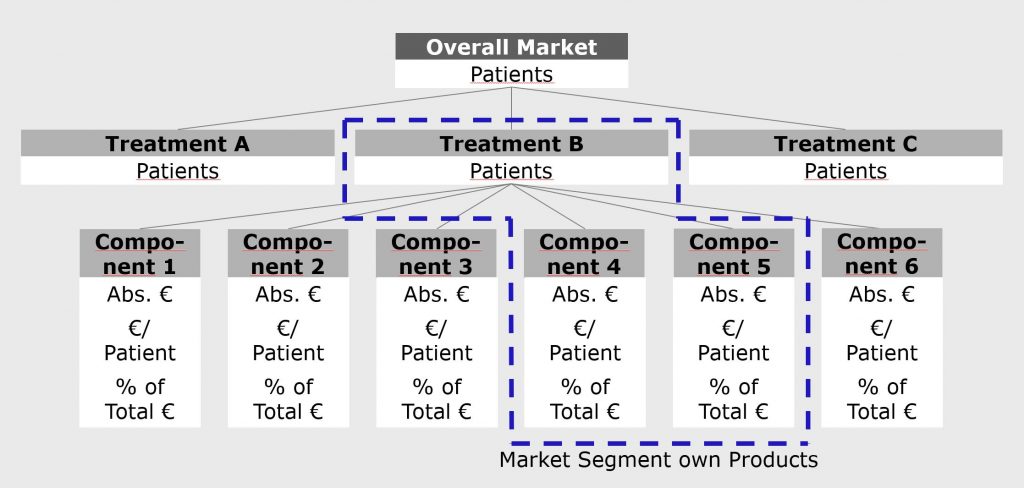
To illustrate the process of deriving that information, let us look at a company in the pharmaceuticals/healthcare sector that seeks to derive the overall cost and potential future cost dynamics for a disease treated with the company’s products. The company has good knowledge of the basic drivers of the market, in this case total patients, their access to different levels of medical care, and their split into current treatment modalities (e.g. surgery, different drug types,…), usually on a country level. The societal impact of undiagnosed and untreated cases can also be included in this approach. There is also a sense of possible future developments of these drivers. However, in a case like this, there will be very limited cost data available beyond the own products and their immediate competitors. A pharmaceutical manufacturer will know its own prices and volumes as well as those of competitors, including their market shares, but will usually have at best vague knowledge on things like hospitalization or home care cost. There will be information available on these components, but it will usually be fragmentary, and it will generally be difficult to estimate overall cost and cost dynamics based on this information alone. The information will for example be limited to single countries and either single or varying composites of cost factors. The approach in this case is to leverage the information available within the company to provide a basic structure to which the fragmentary knowledge on other cost factors can be linked. For that purpose, an overall cost component tree is developed, of which the overall drivers (patients and treatment modalities) and own market segments constitute the known part.

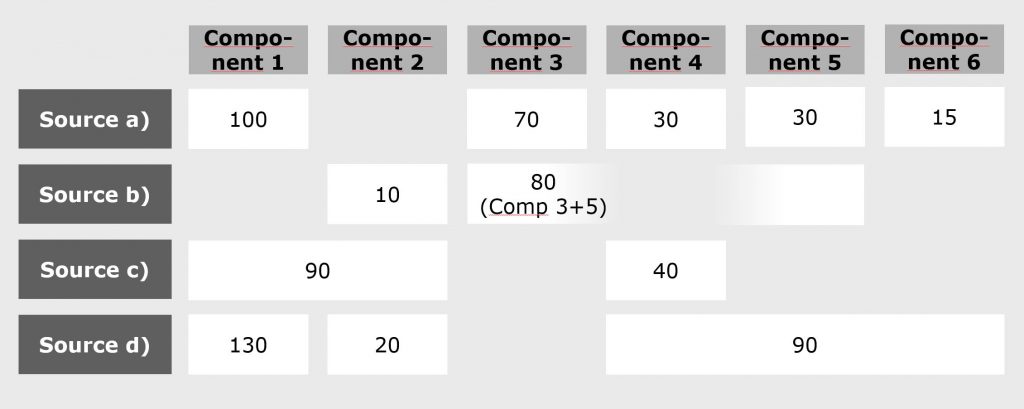
To fill the unknown parts of the component tree, a number of sources from market research companies, scientific researchers, regulatory bodies and statistical offices is evaluated. They provide either aggregate total cost figures related to patient numbers, which can vary greatly by country, or ratios of different cost components, which tend to be more stable. The sources will be of different scope, relevance and validity: Each source usually includes only a subset of the cost components, and in many cases, components will be included in the form of different composites. In addition, the information derived will often be contradictory.

That, however, is more a strength than a weakness of this approach: The model with the data available constitutes an overdetermined system, in which the weaknesses of the empirical data can balance each other in an overall numerical optimization.
In many cases, percent shares of cost components will be more stable between different sources and markets than absolute numbers. Therefore, the overall structure of the cost component tree is described in the form of shares, which can then be applied to the scope and granularity of the different data sources.
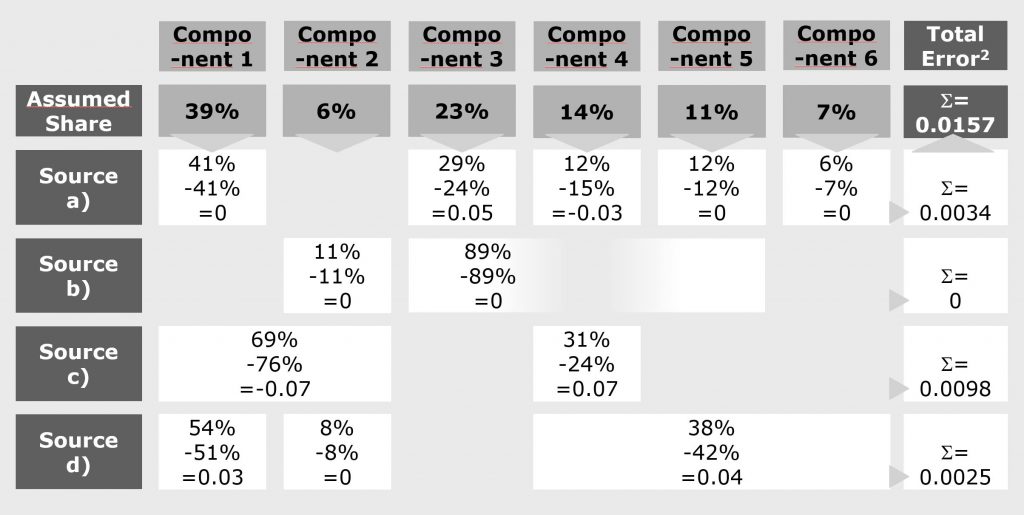
Rather than trying to derive the overall component shares directly from the incomplete and incoherent information in the sources, a “current best assumption” set of overall shares is used as a starting point for a systematic optimization process. For these assumed shares, expected results can be derived for the data structure of each source. From the deviations of all shares in each source, an error parameter for that source is calculated, resulting in an overall error for the assumed shares.

In the graph above, for each data point, the first row indicates the cost share of the component within the data available from that source. The second row is the expected cost share within this available data, based on the assumed share distribution shown at the top. The third row is the deviation of actual and expected share for that source, written as simple decimals. The total error parameter is calculated by adding the squares of the individual errors.
Minimizing the sum of squared errors follows the idea of a statistical regression. To reduce the effect of single outliers in component values, which may be results of unreliable data, the absolute value of deviations can be used instead of the squared errors. In addition, weights can be applied to account for differences in validity or relevance of the different sources. The weights are applied to the total error parameter for that source. If sufficient data is available, separate instances of the model can be implemented for sets of regional markets (e.g. mature, evolving, developing), in which the weights on the sources are varied depending on their respective relevance.
In the final step, the set of assumed shares is optimized, minimizing the overall error parameter. The optimiziation problem is nonlinear, but generally continuous. In real cases, there will often be dozens of sources and more than ten cost components per segment/treatment modality. Therefore, a numerical or heuristical optimization of the shares will be needed. Mathematical tools for this task are available for most commonly used data platforms. To evaluate the stability of the optimization, multiple optimization runs should be done, varying the starting assumptions.

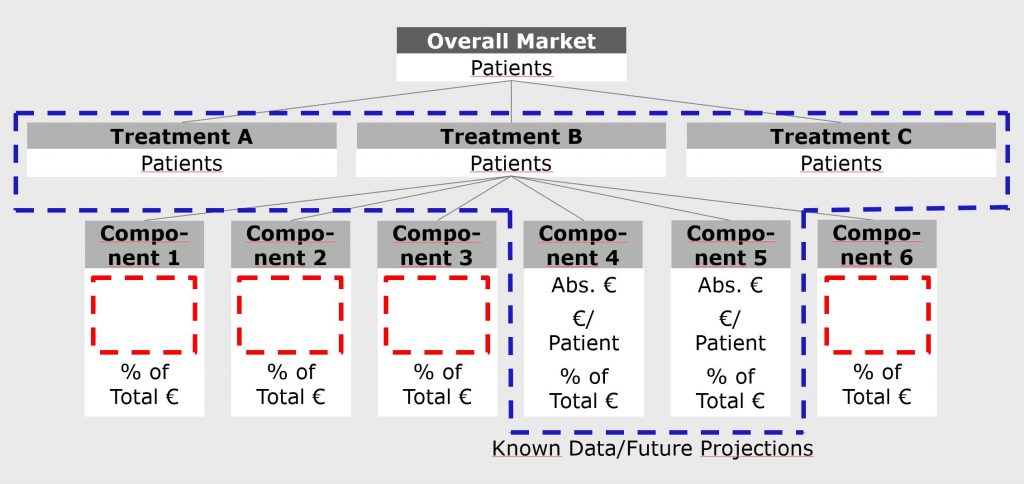
The resulting component cost shares can now be used to extrapolate from sums of known to unknown components. This will work with a relatively high precision for segments/treatment modalities in which significant components are known, but with a lesser precision, it can also be used across segments.
To project the model into the future, scenarios for market dynamics can be applied to the known own market data, for which future scenarios may already be in place and agreed upon in the company, but also to the component shares. That way, it is possible to also project effects like increasing cost of labor in evolving markets or expiring patents for key pharmaceuticals on the overall market.
Obviously, the approach cannot replace a detailed market analysis in any new segment in preparation of significant investment decisions. Beyond the look at overall market size, it can, however, also serve as a quick screening for further opportunities in adjacent segments, which can then be investigated in more detail.
