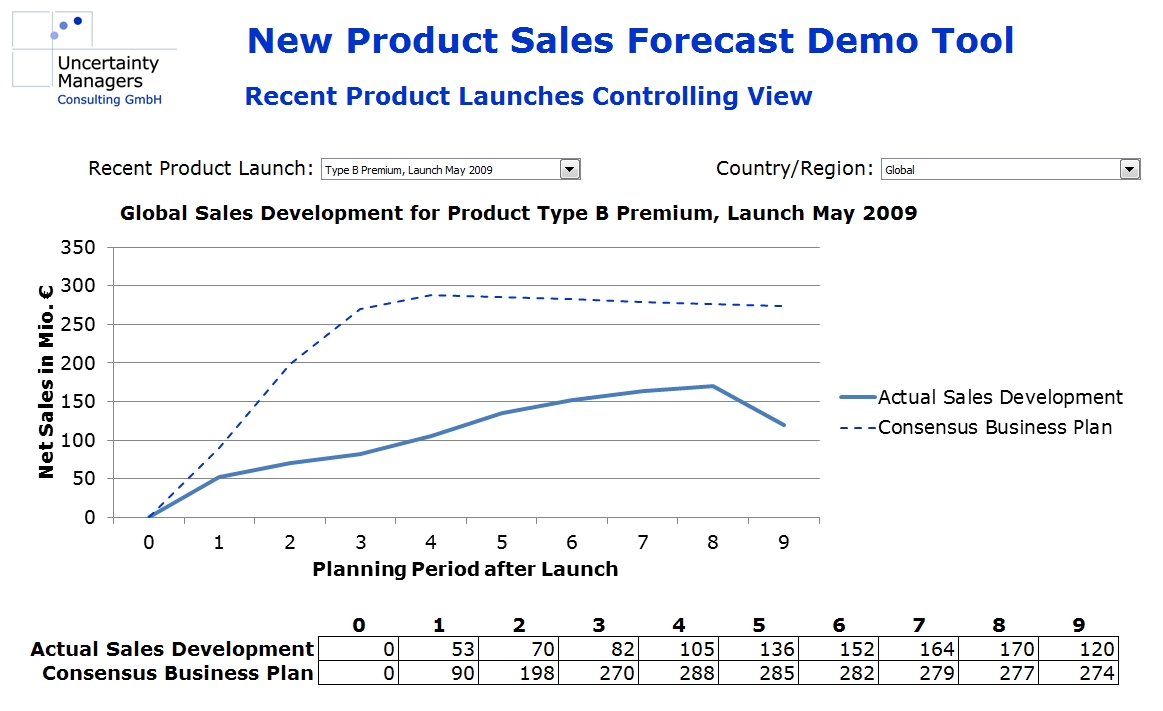
Forecasting sales for new products is among the most difficult tasks in planning. There is nothing to extrapolate, and in the early stages, there is not even a finished product to present to customers and get their feedback. At the same time, sales forecasts for product innovations are inevitable. Some innovators say they cannot forecast, some say the do not forecast, but in the end, who doesn’t calculate sales forecasts explicitly will do it somewhere, somehow implicitly, often in a less thoughtful and therefore less careful way.
For the following case study, let us assume we are in an innovation-driven industry, which regularly develops new products. The current sales forecasts for product innovations have been done based on model assumptions and market research. Controlling has shown significant, unexplained discrepancies between planning and actual sales developments.
There is a variety of methods available to forecast product innovation sales. For development products that are advanced enough to be presented to potential customers, conjoint analysis offers a tool to gauge perceived product advantage. While that product advantage is quite useful to determine what might be seen as a fair price, its connection to the achievable market share is obvious as a fact but not trivial in numbers. The Dirichlet Model of Buying Behavior links market penetration to market share and can thus be used to estimate the impact of marketing activities. It assumes market shares to be constant over the relevant period of time, but appears sufficiently tested to be considered valid at least for the peak market share to be reached by a product. Regarding the development of market share over time, the Fourt-Woodlock model differentiates between product trials and repeat purchases, whereas the Bass diffusion model describes the early phases of a product lifecycle in more mathematical terms, claiming to model the share of innovators and imitators among customers. For high repeat purchase rates and a vanishing share of imitators, both models are more and more similar.
The problem with all of these models is that in spite of all their assumptions, they still contain quite a few free parameters. In practical use, these parameters have to be derived from market research, taken from textbooks or guessed, introducing a significant degree of arbitrariness into the forecasts. The problem becomes apparent in this quote attributed to mathematician John von Neumann: “With four parameters I can fit an elephant, and with five I can make him wiggle his trunk.” In fact, we will do just that, and the trick will be to find the proper elephant.
A totally different approach from these models would be to go by experience. What has been true for previous product launches, by one’s own company or by others, should have a good chance of being true for for future new products. Obviously, while having personal experience with the introduction of new products will help in managing such a process, a realistic forecast will have to be based on more than the experience of a few products and, therefore, individual managers. Individuals tend to introduce various kinds of bias in their judgements, which makes personal experience invaluable for asking the right questions but highly problematic for getting unbiased, reliable answers.
On the other hand, there is usually plenty of “quantitative experience” available. The company will have detailed data about its own product launches in the target market and in similar markets, and market research should be able to provide market volumes and market shares for competitors’ past innovations. Aligned, scaled to peak values and visualized in a forecast tool, the market share curves from past data could, for example, look like this: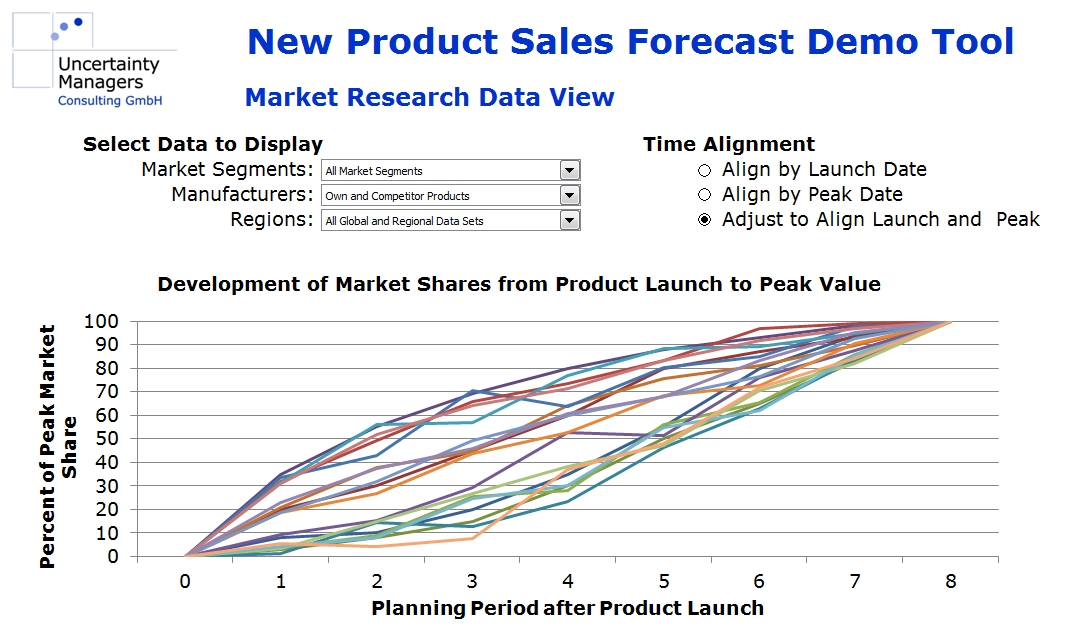
The simplest way to estimate new product sales would be to find a suitable model product in past data and assume the sales of the new product will develop in roughly the same way. That is relatively close to what an experienced individual expert asked for a judgement would probably do, with or without realizing it. Unfortunately, this approach can be thwarted by a variety of factors influencing the success of new products: 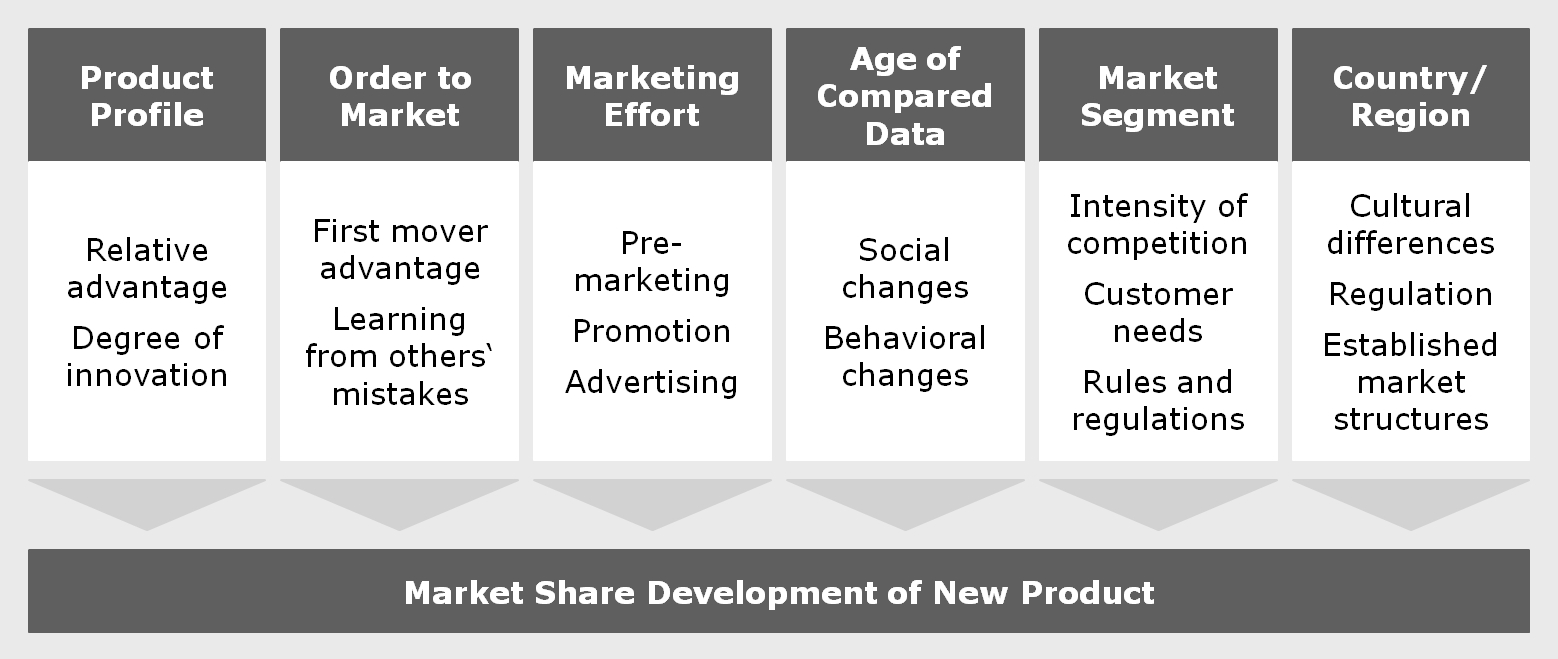
The varying influence of all these factors will make it, at best, difficult to find and verify a suitable model in past data. Besides, judging from one model product yields no error bars or other indication of the forecast’s trustworthiness.
Apparently, to get a reasonable forecast, we need a more complex system, which should be able to learn from all the experience stored in past data. The term “learn” indicates artificial intelligence, and in fact, AI tools like a neural network could be used for such a task: It could be trained to link resulting sales or market share curves to a set of input parameters specifying the mentioned influences. The disadvantage of a neural network in this context is that the way it reaches a certain conclusion remains largely intransparent, which will not help the acceptance of the forecast. Try explaining to your top-level management that you have reached a conclusion with a tool without knowing how the tool came to that conclusion.
On the other hand, there is no need to model a new product exclusively from past data without any further assumptions. All the more analytical models and forecast tools cited above have their justification, and they define a well-founded set of basic shapes, which sales of new products generally follow. New product market shares will usually rise to a certain peak value in a certain time, after which they will either decrease or gradually level off, depending on market characteristics. The uptake curve to the peak value will be either r- or s-shaped, and can usually be well fitted by adjusting the parameters of the Bass model. The development after the peak is usually of lesser importance and depends strongly on future competitor innovations, which are more difficult to forecast. Often, relatively simple models will be able to describe the data with sufficient accuracy – if they use the right parameters.
Generally, all published sales forecast models use market research data from actual products to verify their validity and to tune their parameters. The question is to what extent that historical data actually relates to the products and markets we want to forecast. In this case, we are simply using model parameters to structure the information we will derive from recent market data from our own markets. Based on an analysis of the available data, we have selected the following set of parameters to structure the forecast:
- Peak market share
- Time from product launch to peak market share
- Bass model innovation parameter p
- Bass model imitation parameter q
- Post-peak change rate per time period
The list may look slightly different depending on the market looked at. Tuning these parameters to the full set of the available data would lead to the average product. On the other hand, we have to take into account the influencing factors displayed in the graph above. These influencing factors can be quantified, either as simple numbers by scoring or by their similarity to the new product to be forecasted. This leads us to the following structure of influence factors, forecast parameters and forecasted market share development: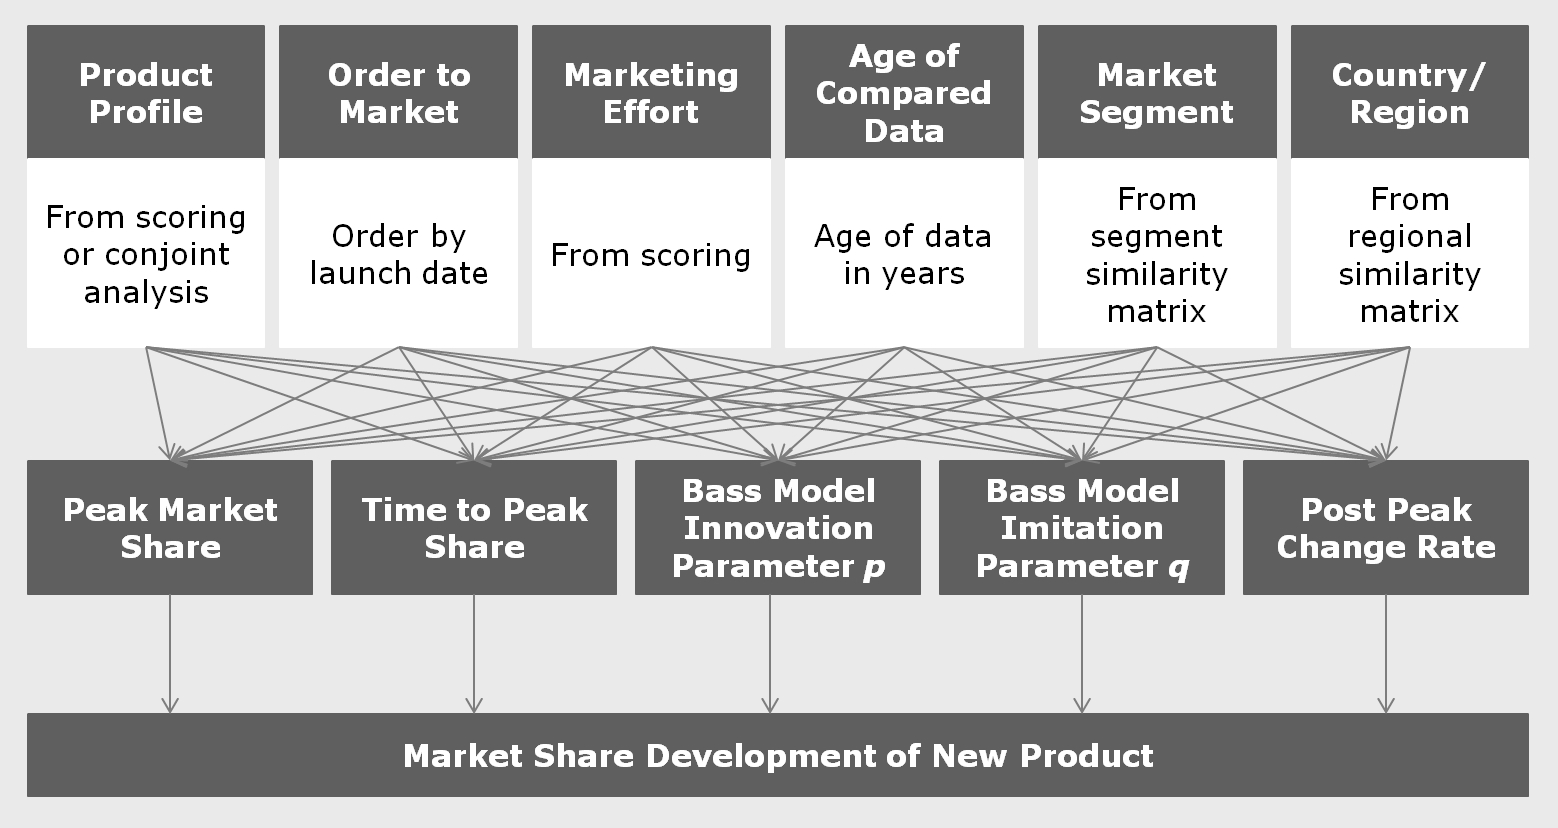
If the parameters were discrete numbers, this graph would describe a Bayesian network. In that case, forecasting could take the form of a probabilistic expert system like SPIRIT, which was an interesting research topic in the 1990s.
In our case, however, the parameters are continuous functions of all the influencing factors, which we approximate using simple, mostly linear, dependencies. These approximations are done jointly in a multidimensional numerical optimization. For example, rather than calculating peak market share as a function of product profile scoring, everything else being equal, we approximate it as a function of product profile, order to market, marketing effort and the other influencing factors simultaneously. The more market research data is available, the more detailed the functions can be. For most parameters, however, linear dependencies should be sufficient. As the screenshot from the case study tool shows, the multidimensional field leads to reasonable results, even if research data is missing in certain dimensions (right hand side graph). 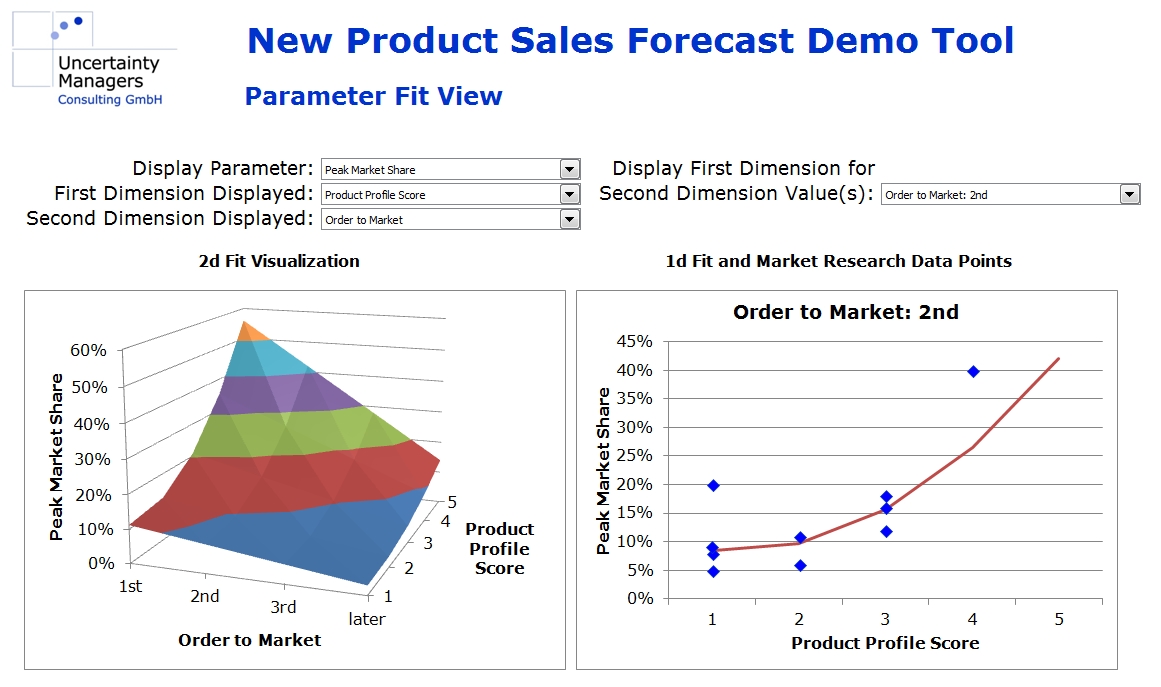
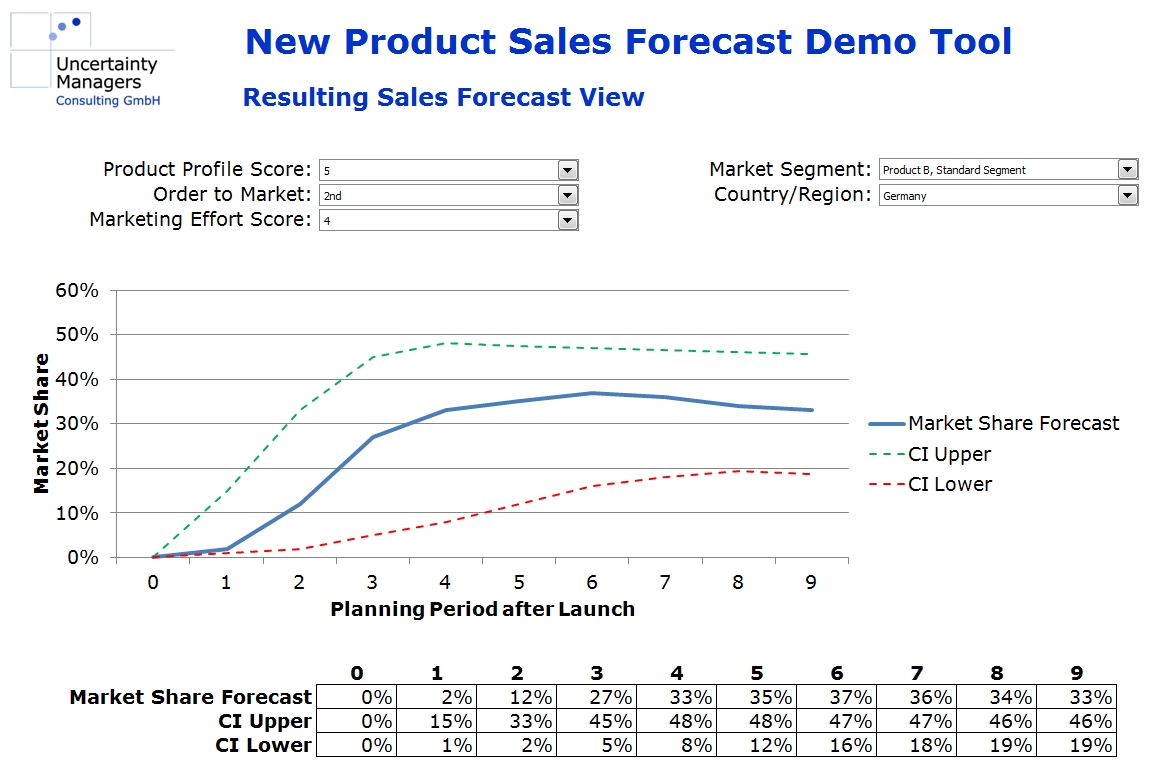
In addition, confidence intervals can be derived in the fitting process, leading to a well-founded, quantitative market share forecast implemented in an interactive model that can be used for all new products in the markets analyzed. Implemented in a planning tool, forecasts from that model could look as follows:
Forecast numbers will depend on the values of the different influence factors selected for the respective product innovation.
This approach presented can be implemented for a multitude of different markets and products, provided there is sufficient market research data available. While using known and well-researched models to structure the problem, the actual information used to put numbers in the forecast stems entirely from from sales data on actual, marketed products. Besides this pure form, it can also be combined with more theory-based approaches, depending on the confidence decision makers in the company have in different theories.
Dr. Holm Gero Hümmler
Uncertainty Managers Consulting GmbH

